XRP Holds Strong Support, Eyes 44% Surge to $4.804
XRP Current Market Overview: Technical Rebound Taking Shape
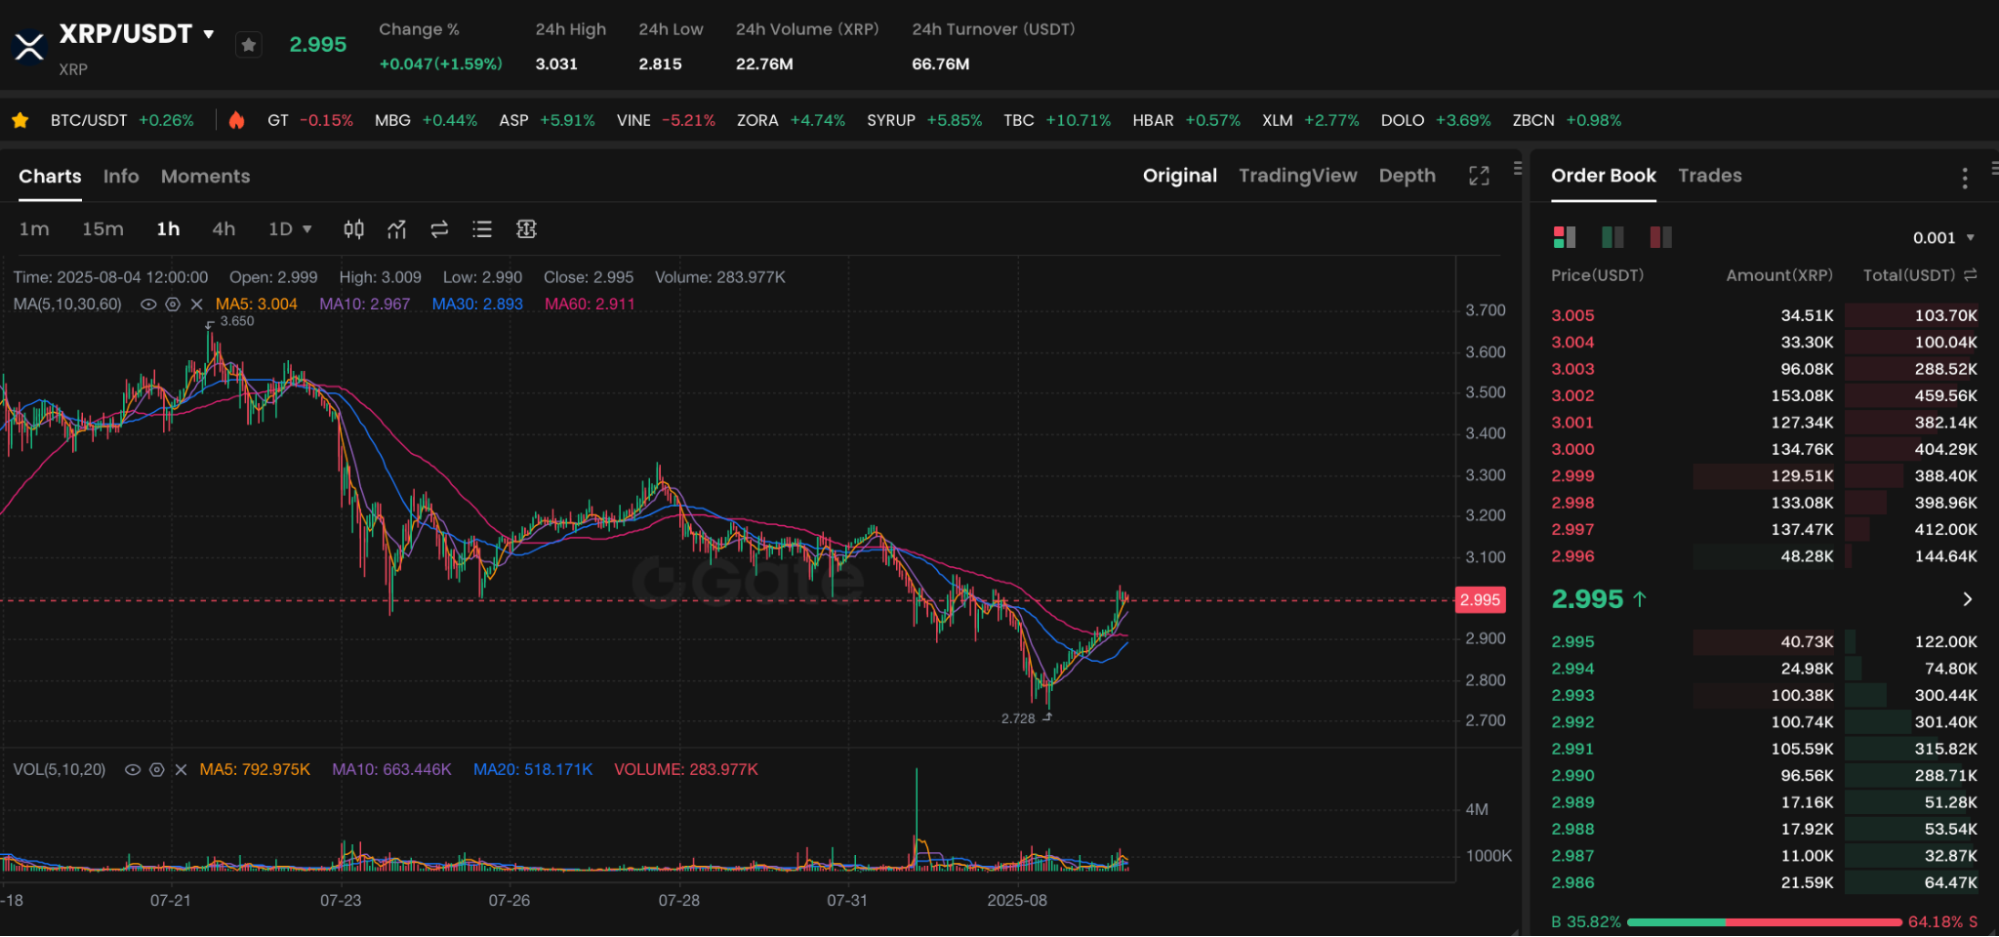
Chart: https://www.gate.com/trade/XRP_USDT
Since the end of 2024, XRP has generally trended higher in a choppy, gradual uptrend. After a prolonged period of sideways consolidation, XRP began to break out in July 2025. Currently, XRP is trading at $3.12. This marks a notable increase from the key support level at $2.47.
Analyst Javon Marks notes that as long as this support holds, XRP is poised to continue its rally, with a target of $4.804—a level that has served as a significant pivot point in past rebounds and holds strong technical relevance.
Key Support Level Analysis: Technical Implications of $2.47
The $2.47 price level is particularly significant in technical analysis of XRP. Historically, XRP encountered resistance and was rejected at this zone. This time, not only did it break through $2.47, but it also successfully retested the level as support. This “resistance becomes support” scenario is a classic bullish technical indicator.
If XRP continues to trade steadily above $2.47 in the coming weeks, we can expect a clear bullish shift in market sentiment, likely drawing additional capital and fueling further upside momentum.
The Rationale Behind the $4.804 Price Target
Technical reasoning strongly supports the $4.804 target proposed by Javon Marks:
- Fibonacci Extension: The move from $2.0 to $3.0, projected upward with a 1.618 Fibonacci extension, precisely targets $4.804.
- Historical Resistance: The $4.8 range repeatedly capped rallies and marked failed breakouts in 2021, making it a key reference point.
- Rising volume confirms breakout potential: The recent price rise has been accompanied by growing trading volume, signaling robust capital inflows and reinforcing the breakout potential.
A decisive breakout above $4.804 would likely trigger a new major uptrend, with the next major target potentially extending to $7.138.
Technical Indicators: Moving Averages and Trendline Convergence
- MACD Bullish Crossover: Indicates an emerging bullish trend;
- 50-Day Moving Average Crossing Above 200-Day Moving Average: The classic “golden cross,” signaling long-term upward momentum;
- Bollinger Bands Widening: Increased volatility, signaling potential breakout conditions.
Together, these technical indicators confirm that XRP is in the early stages of a bullish phase.
Actionable Strategies: How to Time Your Entry
Most individual investors may consider the following staged entry approach:
- First Entry Range: Build a small position between $2.8 and $3.0 to manage risk;
- Second Entry Range: Increase holdings after a confirmed breakout above $3.3;
- Take-Profit Target: $4.804;
- Stop-Loss: If XRP falls below $2.4, consider exiting to avoid losses from a potential reversal.
Conclusion: Solid Support, Encouraging Outlook
Assessing the latest price action, technical support levels, and capital flows, XRP stands at the threshold of a new upward trend. As long as the $2.47 support holds, a 44% climb for XRP toward $4.804 is an attainable scenario. For investors with long-term confidence in Ripple’s technology and ecosystem, now could be a strategic window for strategic portfolio allocation.
Share
Content
XRP Trend Overview: Early Signs of Technical Rebound
Key Support Level Analysis: The Technical Significance of $2.47
Target Price Rationale: The Logic Behind $4.804
Technical Indicators: Interaction of Moving Averages and Trendlines
Actionable Strategies: Timing Your Entry Points
Conclusion: Solid Support Could Signal a Promising Future
Related articles

Pi Coin Transaction Guide: How to Transfer to Gate.io

What is N2: An AI-Driven Layer 2 Solution

Grok AI, GrokCoin & Grok: the Hype and Reality

How to Sell Pi Coin: A Beginner's Guide

Crypto Trends in 2025
